


How to add a chart to a webpage created with PHP Generator?
Last modified: May 14, 2013
| Prev | Next |
Abstract
The article illustrates how to add charts to pages produced by PHP Generator with the help of popular chart libraries.
Problem
Charts provide a perfect way to visualize data. You can easily add a chart to a webpage created with PHP Generator using its built-in feature named custom templates and any of available JavaScript chart libraries like freeware Google Chart or commercial tools such as HighChart and FusionCharts.
Solution
The main ideas of webpage appearance customization were described in the previous article. According to them we have to follow these steps:
- create a new template;
- instruct PHP Generator to use this template for a certain webpage;
- add code that renders the chart to the template.
You can find a live example of a page with a chart in our demo application.
In the examples below we will create various charts based on the following result set returned by a query.
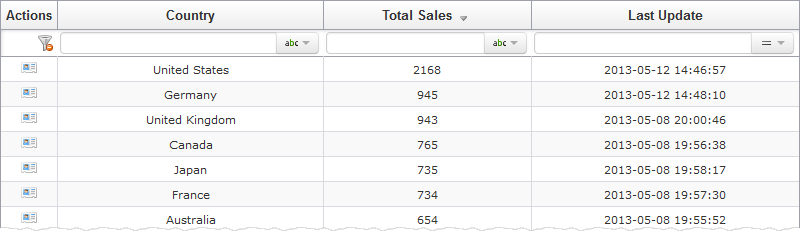 Picture 1. The 'Sales By Country' webpage.
Example 1
As the first example we take as a goal to add to the top of the 'Sales By Country' page a Geo Chart, a chart with a map of the World with countries filled with colors corresponding to the sales volumes. As a chart library we use Google Charts.Step 1
First we need to create a custom template file. Of course, you can create the custom template from the scratch, but it's easier to get as a basis the template that is currently used. As we want to modify the appearance of the data grid, we have to use the components/templates/list/grid.tpl template file. Let's copy it to the custom_templates folder with another name, e.g. sales_by_country_edit.tpl.
Step 2
Now we need to specify the generated application to use the new template file for the grid of the sales_by_country webpage. To do this, open the editor of this page in PHP Generator, specify the OnGetCustomTemplate event handler code, and regenerate the application.
if ($part == PagePart::Grid && $mode == PageMode::ViewAll)
  $result = 'sales_by_country_grid.tpl';
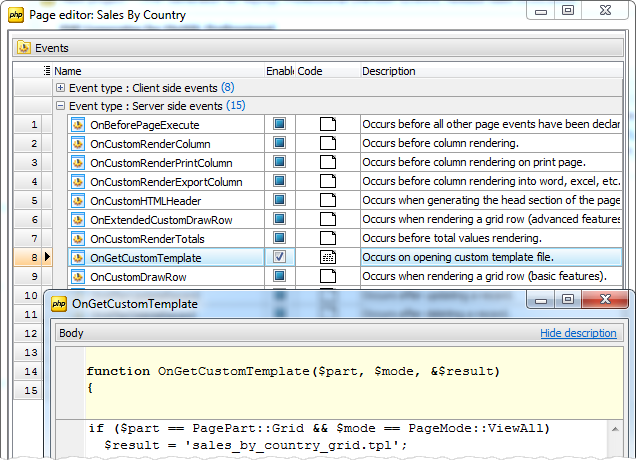 Picture 2. Specifying the edit handler
Step 3
Now the appearance of the grid at the 'Sales By Country' webpage completely depends on the sales_by_country_grid.tpl file content. To add a chart to the page, simply place the necessary code at the beginning of the sales_by_country_grid.tpl file using any text editor.
{literal}

// Loading necessary libraries.
<script type='text/javascript' src='https://www.google.com/jsapi'></script>
<script type='text/javascript'>
 google.load('visualization', '1', {'packages': ['geochart']});
 google.setOnLoadCallback(drawRegionsMap);

  // Callback that creates and populates a data table,
  // instantiates the geo chart, passes in the data and draws it.
  function drawRegionsMap() {

    // Create the data table and populate it with content of the 'country' and 'total_sales' columns.
    var data = google.visualization.arrayToDataTable([
      ['Country', 'Total Sales']
      {/literal}
      {foreach item=Row from=$DataGrid.Rows name=RowsGrid}
          ,['{$Row.DataCells.country.Data}', {$Row.DataCells.total_sales.Data}]
      {/foreach}
      {literal}
      ]);

    // Set chart options.
    var options = {};

    // Instantiate and draw our chart, passing in some options.
    var chart = new google.visualization.GeoChart(document.getElementById('chart_div'));
    chart.draw(data, options);
};
</script>

{/literal}

// Div that will hold the chart.
<div style="height: 600px; overflow: visible;">
  <div id="chart_div" style="width:900px; height:500"></div>
</div>
The result is shown below.
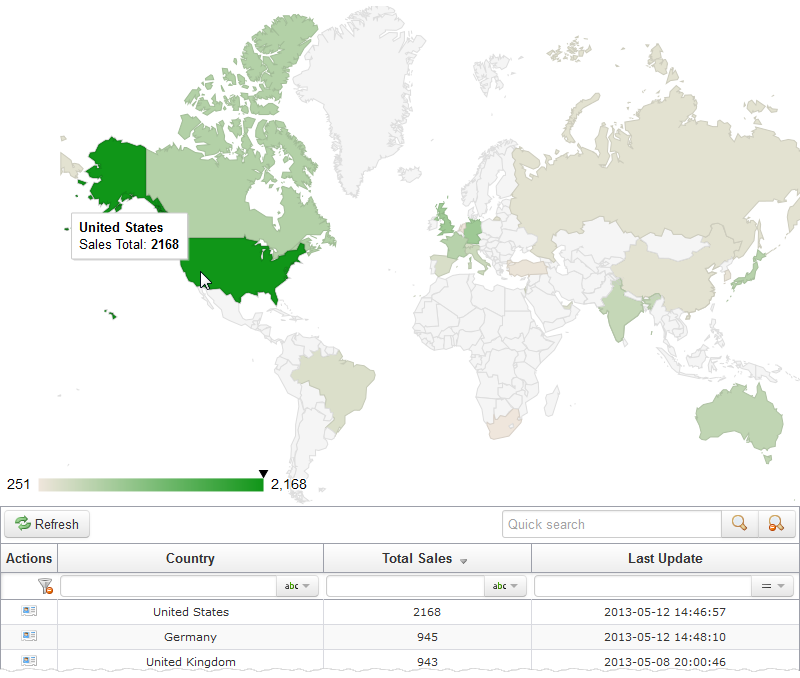 Picture 3. The result page with the geography chart.
Example 2
Now we want to add a Column Chart using the Fusion Charts library. To use this package, we need to copy all the library files to any directory of the computer the webserver is installed on.
The first and second steps in this case are the same as in the previous example. The block code corresponding to the selected chart is shown below.
{literal}

<script language="Javascript" src="FusionCharts/Charts/FusionCharts.js"></script>

{/literal}

{php}

// Loading necessary libraries.
include "FusionCharts/Code/PHPClass/Includes/FusionCharts_Gen.php";

// Creating the appropriate object.
$FC = new FusionCharts("Column2D", "800", "400");

// Populating the data.
$DataGrid=$this->get_template_vars('DataGrid');
foreach ($DataGrid['Rows'] as $row)
    $FC->addChartData($row['DataCells']['total_sales']['Data'], "Label=".$row['DataCells']['country']['Data']);

// Adding the chart to the webpage.
$FC->setRenderer('javascript');
$FC->renderChart();
{/php}
Here you can see the result of our operations.
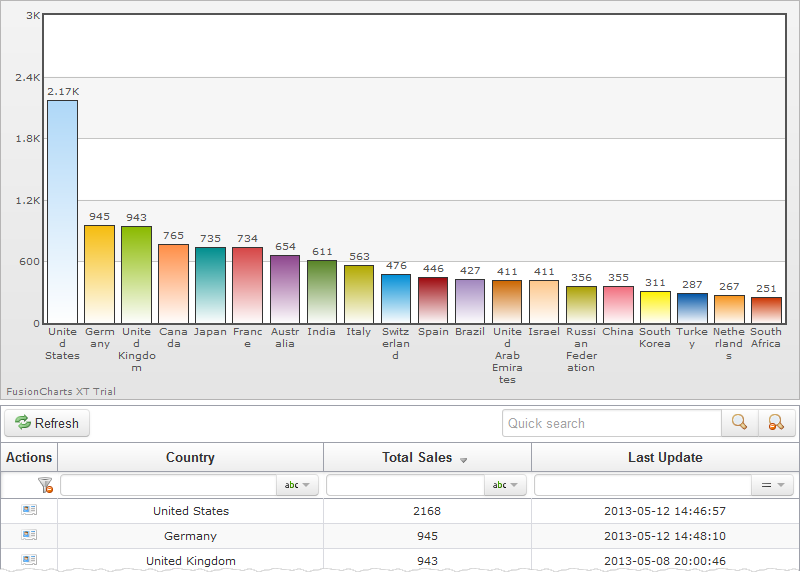 Picture 4. The 'Sales By Country' webpage with the Fusion column chart.
Example 3
Now let's add a Pie Chart of the HighCharts library. As in the previous example we skip to the third step. The code that should be entered into the sales_by_country_grid.tpl file is as follows.
{literal}

// Loading necessary libraries.
<script src="http://code.highcharts.com/highcharts.js"></script>
<script src="http://code.highcharts.com/modules/exporting.js"></script>

//Setting chart options.
<script type="text/javascript">
$(function () {
    $('#container').highcharts({
            chart: {
                plotBackgroundColor: null,
                plotBorderWidth: null,
                plotShadow: false
            },

	    title: {
                text: ''
            },

	    tooltip: {
                pointFormat: '{series.name}:<b>{point.percentage:.1f}%</b>',percentageDecimals: 1
            },

	    plotOptions: {
                pie: {
                    allowPointSelect: true,
                    cursor: 'pointer',
                    dataLabels: {
                        enabled: true,
                        color: '#000000',
                        connectorColor: '#000000',
                    }
                }
            },

	    title: '',

            series: [{
                type: 'pie',
                data: [
		{/literal}

                // Preparing the data for the chart.
		{foreach item=Row from=$DataGrid.Rows name=RowsGrid}
		    {if $smarty.foreach.RowsGrid.index > 0}
		    ,
		    {/if}
	            ['{$Row.DataCells.country.Data}',
		    {$Row.DataCells.total_sales.Data}]
		{/foreach}

                {literal}
		]
	    }]
        });
    });
</script>
{/literal}

// Adding the chart to the webpage.
<div id="container" style="width: 100%; height: 400px;"></div>
The result is shown below.
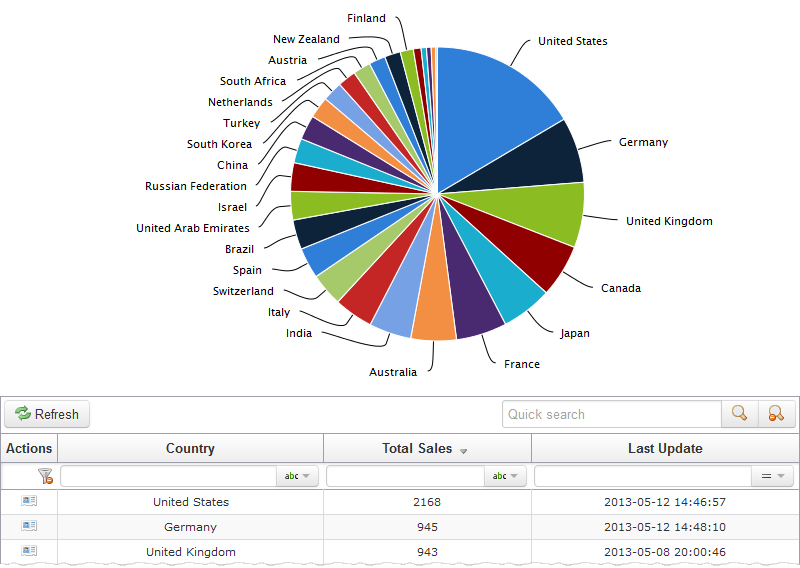 Picture 5. The 'Sales By Country' webpage with a pie chart.
Conclusion
We hope you have been convinced of the simplicity of working with chart libraries in PHP Generator and now the only limit of using charts on your webpages is your imagination!
| Prev | Next |