


PostgreSQL Maestro: Product Tour
PL/pgSQL Debugger
|
The PL/pgSQL Debugger tool allows you to debug PL/pgSQL functions using traditional debugging features such as setting breakpoints, viewing variable values, and examining the call stack. PL/pgSQL Debugger is very easy to use. No extra actions or conversions are needed and no limitations exist. Just execute the program unit in the debugger and step through your code. To start working with the debugger, choose the Tools | PL/pgSQL Debugger main menu item. You can also use the appropriate command from the object pop-up menu in the Database Explorer tree. |
|
|
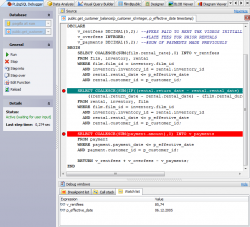
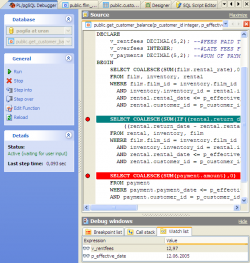
The PL/pgSQL Debugger window consists of three parts: Source, Debug window, and Navigation bar. The Source tab contains script editors for each program unit, so that you can easily switch between them to view the source, set/remove breakpoints, and so on. After starting the debugger, execution will pause on the first script statement. After this, you can control execution with the buttons in the Navigation bar: to run the script until completion, a breakpoint or an exception; to move to the next line (Step Over), to open the nested procedure as the new Source instance to debug it line-by-line (Step into). When an exception occurs, the PL/pgSQL Debugger will take you to the line that causes it and you are able to view variable values at the time of the exception. This can obviously be very helpful to find the cause of the exception. |
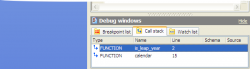
The Debug window is provided to represent the debugging process characteristics such as Breakpoints information, Call Stack, and Watch List. Whenever the debugger is paused, you can use the Call stack window to see the procedure flow as a stack of method calls that got you to the current line. It is automatically updated after each debug step. To view unit variables values, create a watch with the Watch list tab pop-up menu. |
|
| Back | Next |