

 Download
 Buy
BuyOracle Maestro online help
| Prev | Return to chapter overview | Next |
Debugging process
For those programming errors that are really hard to track, Oracle Maestro provides an integrated PL/SQL debugger. The main principles of the debugging process within the PL/SQL Debugger are similar to the same tools methods.
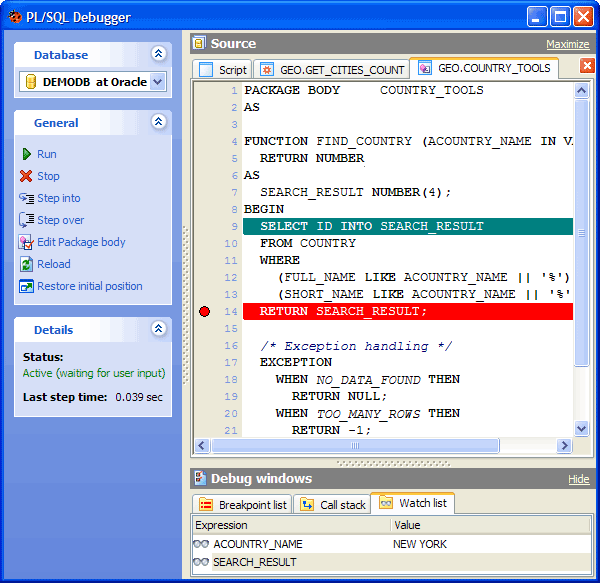
The PL/SQL Debugger window consists of three parts: Source, Debug window, and Navigation bar.
The Source tab contains script editors for each program unit, so that you can easily switch between them to view the source, set/remove breakpoints, and so on.
The Debug window is provided to represent the debugging process characteristics such as Breakpoints information, Call Stack, and Watch List.
You can set the procedure parameters before the debugging process.
To start the debugger, use the Run (F9) link at the Navigation bar.
After starting the debugger, execution will pause on the first script statement. After this, you can control execution with the buttons in the Navigation bar:
Use the Run (F9) link at the Navigation bar to run the script until completion, a breakpoint or an exception.
To move to the next line, click the Step Over icon or use F8. The nested procedure will be executed, but you will not step into the source.
Step into (F7) allows you to open the nested procedure as the new Source instance to debug it line-by-line.
Note: The nested procedure body is available to debug if it was compiled with debug information.
Stop (Ctrl + F2)
Use the link to abort the debugging process. To make changes in the procedure body, use the corresponding Procedure Editor.
Breakpoints can be used to halt program execution on a certain line in your PL/SQL code. When execution halts, you can view variables, step through the code, and so on.
To set a breakpoint, just click on the grey leftmost edge of the code window opposite to a necessary line. To delete a breakpoint, simply click on the breakpoint mark again.
It’s also possible to disable/enable a breakpoint by clicking the breakpoint indicator with pressed Ctrl.
| Prev | Return to chapter overview | Next |