

 Download
 Buy
BuyFirebird Code Factory online Help
| Prev | Return to chapter overview | Next |
Customizing diagram properties
To build a diagram in Diagram Viewer, you should select the source field(s) to be represented in the diagram first. Only numeric types of fields can be used in the diagram, and each selected field corresponds to a separated diagram series. Fields are selected by checking items in the third combo box from the top in the Database group of the Navigation Bar. If the combo box is empty then either data source is not yet selected or it contains no numeric fields.
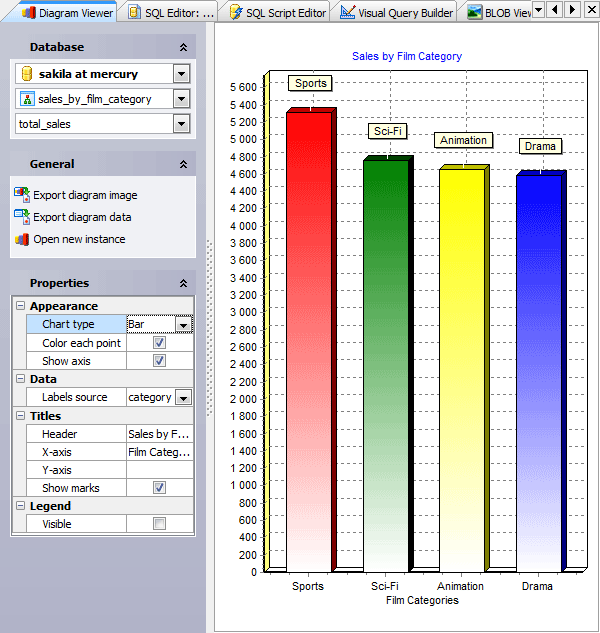
Diagram Viewer provides a special control for customizing the diagram properties. This control is located in the Properties group of the Navigation Bar and consists of four separate subgroups:
Appearance
Contains properties responsible for major diagram appearance:
| • | Chart type - defines a way of how the diagram will be represented: as bars, lines, areas, points, pies, or fast lines |
| • | Color each points - if checked, each bar, point, line or sector of the diagram has an individual color; if not checked, all the points are colored red |
| • | Show axis - defines if the diagram has the axis and background grid or not |
Data
Contains the Labels source property which allows you to specify the field for X-axis labels as well as for diagram point marks .
Titles
Contains properties for defining titles for different parts of the diagram:
| • | Header - defines the title appeared on the top of the diagram |
| • | X-axis and Y-axis - define the titles for diagram axis |
| • | Show marks - defines if the diagram point marks are visible or not |
Legend
The only Visible property of this subgroup specifies whether the legend rectangle should be represented on the right side of the diagram or not.
| Prev | Return to chapter overview | Next |