

 Download
 Buy
BuyOracle Maestro online help
| Prev | Return to chapter overview | Next |
PL/SQL Debugger
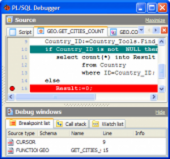
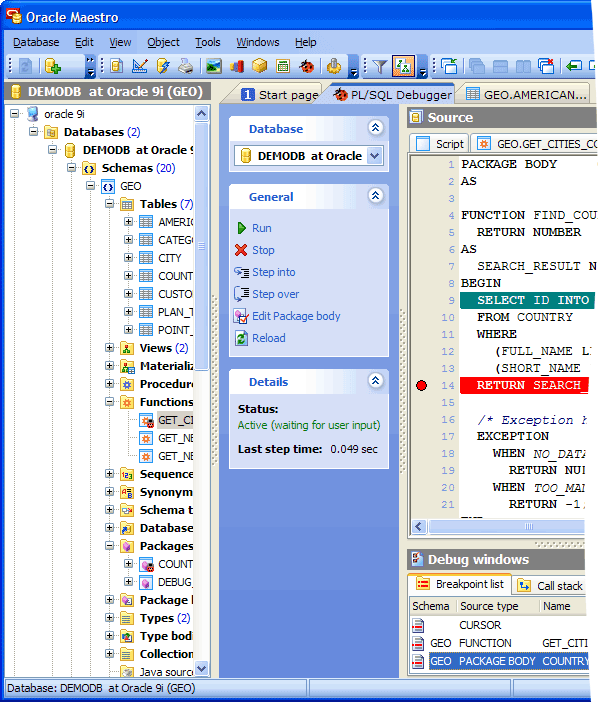
The PL/SQL Debugger tool allows you to debug PL/SQL code such as procedures and functions (both stand-alone and packaged) using traditional debugging features such as setting breakpoints, viewing variable values, and examining the call stack.
To start working with the debugger, choose the Tools | PL/SQL Debugger main menu item. You can also use the corresponding link at the Navigation bar of the Procedure/Function Editor or select the appropriate command from the object pop-up menu in the Explorer tree.
Note: To debug a function/procedure with nested ones, compile them with debug information in advance. Procedures/functions/packages that were compiled in this way have differing object icon in the Explorer tree.
Note: You can also debug an anonymous PL/SQL block. Just open PL/SQL Debugger and paste/enter the script.
| Prev | Return to chapter overview | Next |